


![How to Start an Ecommerce Business in Australia [2023 Guide]](/template/e27cf56f/images/resource-blog-right-img1.png)
B2B Ecommerce KPIs: 5 Metrics That Matter in 2025
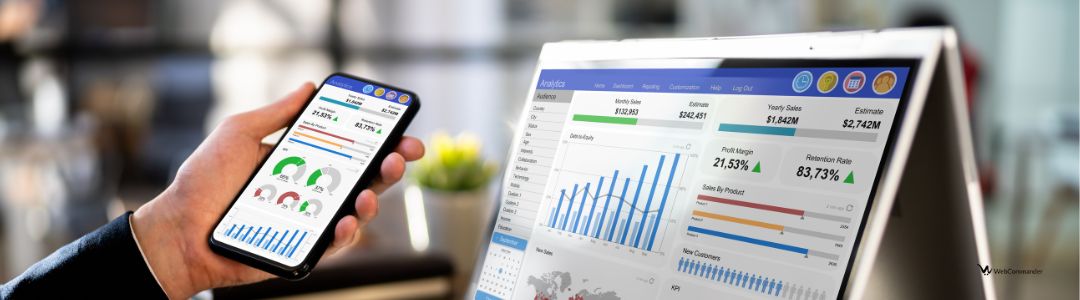
Data is the new currency for today's businesses. Gut feelings and assumptions no longer work to drive sustainable growth. Companies need to make informed decisions backed by measurable insights.
Especially in the B2B scenario where the sales cycles are longer and buying journeys are more complex with multiple decision makers, tracking the right metrics is a must.
If you want to get a complete picture of your ecommerce performance, it's necessary to look beyond sales numbers. When you monitor the right KPIs, not only can you uncover hidden opportunities but also make smarter and faster decisions.
In this article, we will break down the most critical B2B metrics you should be tracking.
Top KPIs to measure for B2B web stores
If you run a B2B ecommerce, you must track a range of KPIs. We can divide the key metrics into several functional areas to make them easier to track and act on.
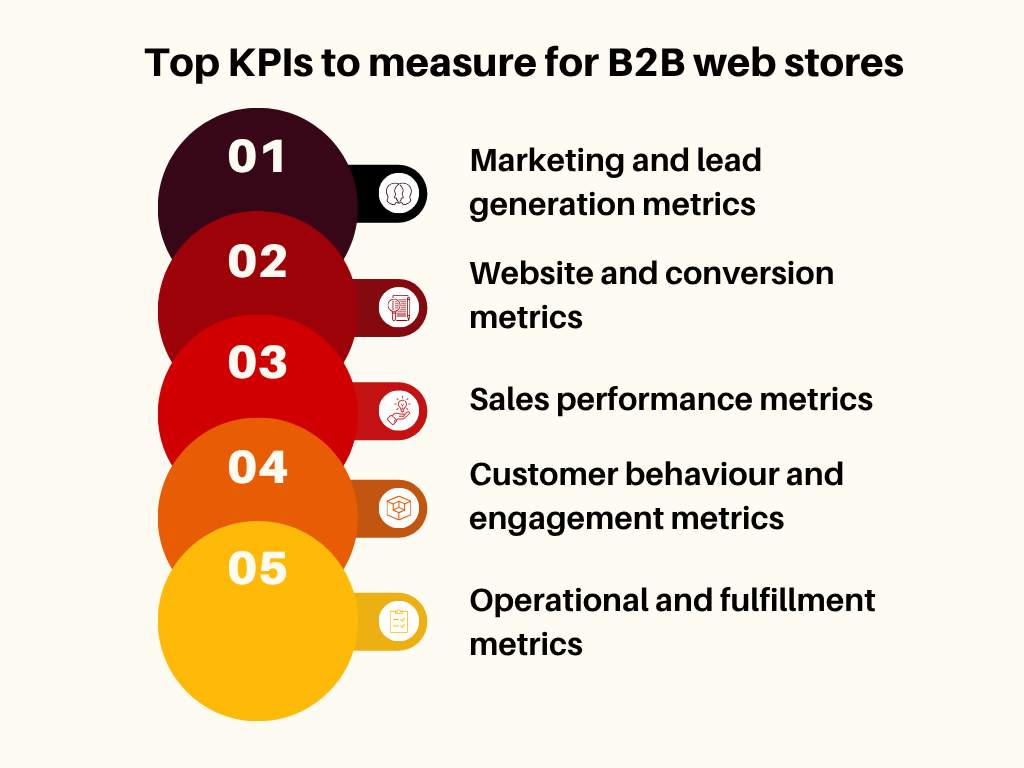
1. Marketing and lead generation metrics
Marketing and lead generation metrics will help you to evaluate how your efforts are working to attract high-quality leads and convert them into paying customers. After all, a customer must find your business, understand your value before they take their steps into your sales funnel and make a purchase.
Customer acquisition cost (CAC)
CAC= total spending on marketing and sales ÷ number of new customers
It measures how much it costs to acquire a new customer, including all marketing and sales expenses. So, if your CAC rate is high, it means that you are spending too much to acquire customers. If the number is lower, it shows that your campaigns are working effectively.
Lead-to-customer rate
Lead-to-customer rate= (Number of customers ÷ number of leads) × 100
These metrics help to track the percentage of leads that have converted into paying customers. If you get a low conversion rate, chances are that you might be failing to nurture your leads properly, or you might be attracting the wrong audiences. This KPI will help you to refine targeting while aligning marketing and sales efforts.
2. Website and conversion metrics
Be it to request a quote, explore your offering, or place an order, your website is the first touchpoint for your potential buyers. When you track these metrics, you can see how the users are interacting with your site, what is working, and what is not.
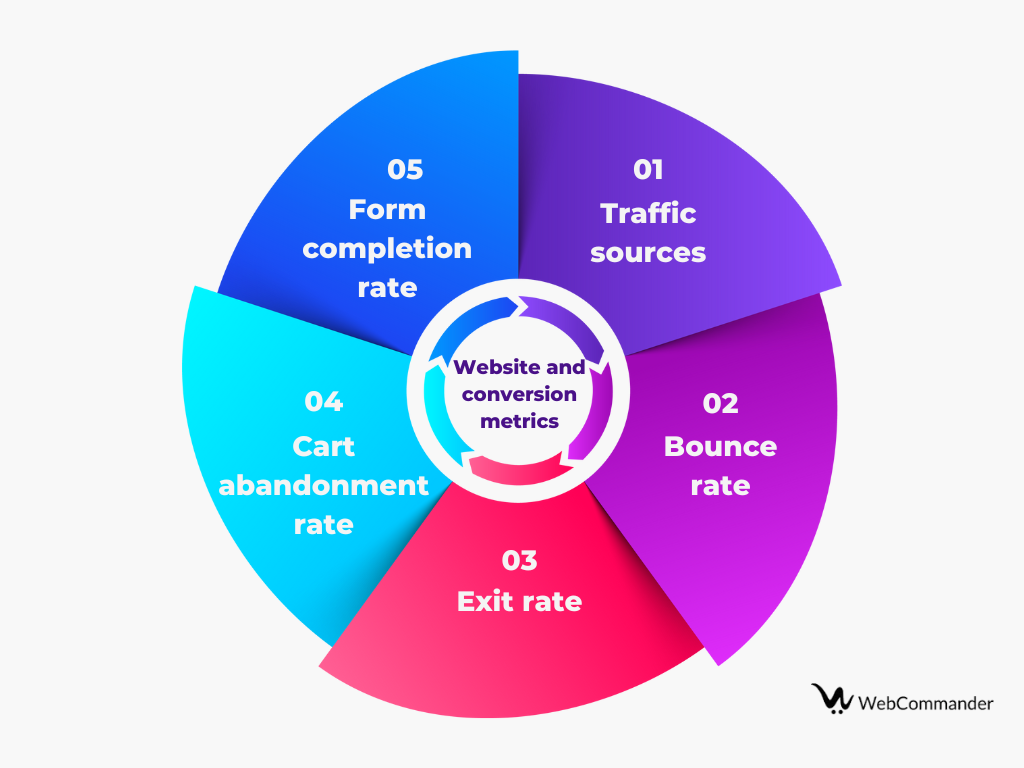
Traffic sources
This will help you detect where your visitors are coming from so that you can measure the effectiveness of your marketing efforts.
Suppose if they are coming through search engines like Google, consider it as organic traffic, and if people are typing your URL directly, consider it as direct traffic. Or if they are coming from other websites linking to yours, it will be referral traffic. With this breakdown, you can find out the most valuable channel to invest more in the future.
Bounce rate
The percentage of bounce rate will help you to find the number of users who have landed on your site and left without taking any action, such as buying the product or filling out a form. If you get a high bounce rate, consider it a result of poor user experience, slow loading times, or less engaging content.
Exit rate
This percentage will show the number of visitors who have left your site from a particular page, even after visiting multiple pages. This will help you to identify where the users are actually dropping off their journey, which can be a product page or a quote request form.
Cart abandonment rate
This will show the number of users who have added items to their cart but still haven't completed their purchases. You can track the metric to detect the actual cause, which can be the complicated checkout process or the lack of payment options.
Form completion rate
You can track the number of users who submit forms like "Request a quote," "Contact sales," or "Sign Up". These are important for lead generation in B2B. If the rate is low, it will signal that your forms might be too long, confusing, or asking for too much information.
3. Sales performance metrics
Sales performance metrics will provide you with a direct view of how your ecommerce store is doing in generating revenue and converting the interests into action. You can track the financial health of your store as well as identify opportunities to optimise pricing, product offerings, and other sales processes.
Total sales revenue
This shows the total income of your store that came from all completed transactions over a specific period. You can see the overall financial performance of your ecommerce business and assess your business growth; identify seasonal trends and evaluate the effectiveness of the campaigns or promotions you are running.
Average order value (AOV)
AOV= Total revenue ÷ number of orders
This metric will help you find the average amount that a customer pays per order. If the AOV is higher, it means that you are getting more revenue from each transaction. Eventually, this improves profit margins.
Sales conversion rate
Sales conversion rate= (Total number of sales ÷ number of visitors or leads) × 100
This rate will show the number of visitors or leads who actually completed a purchase or request. If you are getting a lower conversion rate, it will indicate friction points in the buying process, including poor product descriptions, slow site speed, or other factors.
4. Customer behaviour and engagement metrics
Customer lifetime value (CLV)
CLV= (Average purchase value × purchase frequency × customer lifespan)
This metric will help you to understand the long-term value of retaining a customer. This is necessary in a B2B setting as deals in B2B are of high value and long-term. If the CLV is higher, it will justify the investment in customer service, loyalty programs, and personalised experiences.
Repeat purchase rate
Repeat purchase rate= Number of customers who purchased more than once ÷ total number of customers) × 100
This rate will show the customer satisfaction, trust, and loyalty situation. If the rate is higher, it will suggest that you are meeting your customers' needs.
5. Operational and fulfillment metrics
Monitoring operational and fulfilment metrics will help you to identify delays, eliminate errors, and improve the port-purchase experience.
Order fulfilment time
This shows the average time it takes a customer from placing an order to getting it delivered. Faster fulfilment is a must in B2B as late deliveries can disrupt supply chains or affect a client's operations.
Return rate
Return rate= (Number of returned orders ÷ total orders) × 100
If your return rate is high, it will show that there are problems with product quality, inaccurate descriptions, and shipping damage.
Why are these KPIs important for your business
These KPIs matter, not just for collecting data but to gain visibility into the key drivers of your ecommerce performance. KPIs will help you to make smarter business decisions. For example, you can easily decide which marketing channel to pick to deliver the best ROI, or you can quickly identify the friction points in your checkout process.
Also, you can fine-tune your services and provide a seamless experience by measuring the user behaviour, trends, and other fulfilment performance. When you track metrics such as AOV, CLV, or conversion rate, you can find out hidden opportunities that can directly impact your revenue.
Final words
So, the right KPIs will act as your roadmap. All you need to do is continuously measure, adapt, and improve. It's high time to turn your insights into action and watch your B2B ecommerce store thrive.

